
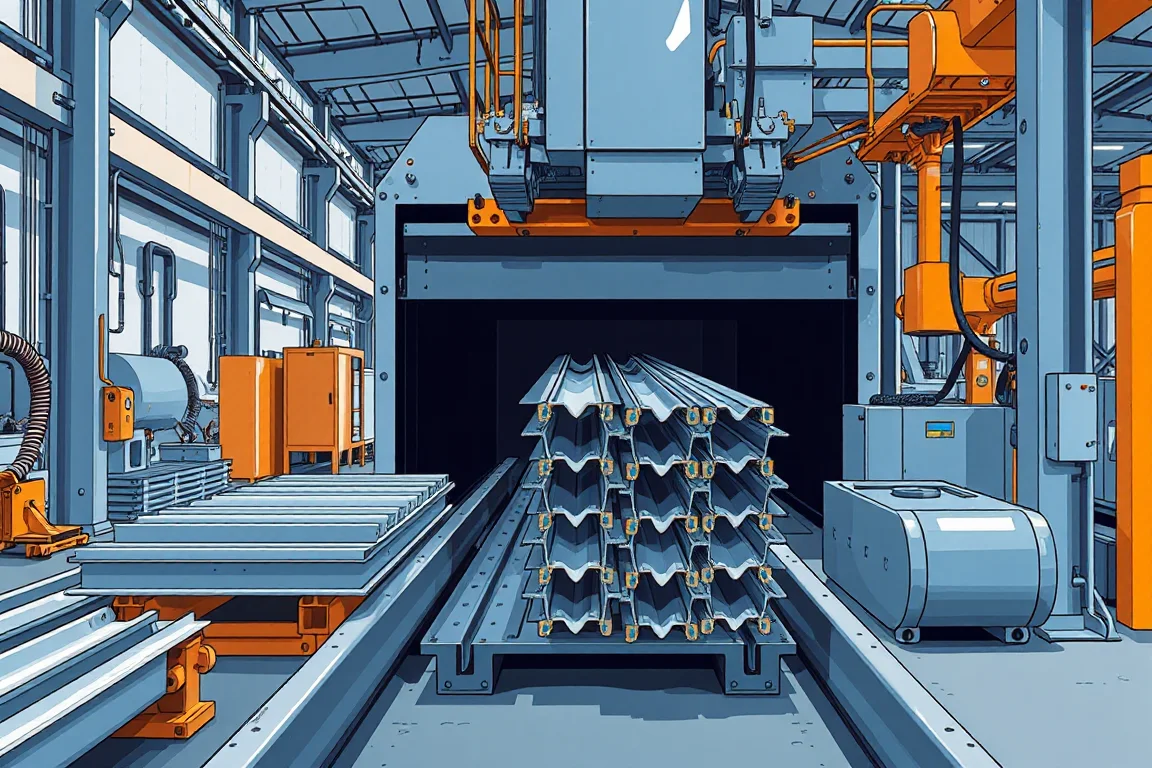
Custom profile production speed is meaningful only when the finished part and production boundary are stated. A line making long plain sections performs different work from one making short, feature-rich components with frequent tool changes. Calculate output from the actual order basket and count accepted parts after the agreed operations.
Choose the output unit that fits the business
Parts, accepted metres and mass can each be useful, but they answer different questions. Parts reflect piece handling and feature counts, while metres describe delivered section length. Keep the unit tied to the order and avoid comparing unlike products through one unexplained number.
Define where counting occurs. Formed material awaiting cutting, punching or inspection is not equivalent to a completed component. Record any downstream operation excluded from the capacity claim so that the overall business plan can account for it.
Build a real order basket
List profile identity, material, length, quantity and required features for representative orders. Include normal changes between sections and materials. A favorable demonstration of one long plain profile does not establish output for repeated small batches of several custom parts.
Keep the expected delivery grouping visible. Producing extra easy parts can raise a daily metre total without completing the customer's required set. Assess completed orders or kits where that is the useful delivery boundary.
Separate theoretical running output from accepted output
A theoretical figure can be calculated from strip speed and part length under clearly stated assumptions. It does not include every interruption, rejection or secondary operation. Use it as a reference point rather than presenting it as a guaranteed shift result.
The accepted count should come from a measured interval that includes the agreed work. Record startup scrap, rejected components, stops and changes separately. That makes the difference between theory and actual delivery understandable.
Work through a mixed-length example
Suppose a hypothetical order contains 120 accepted pieces at two metres and 80 at three metres. Total accepted length is 120 × 2 + 80 × 3 = 480 metres, across 200 individual pieces. If the complete production window is 240 minutes, average delivery is two accepted metres per minute.
The corresponding piece rate is 200 divided by 240, or about 0.83 accepted pieces per minute. Both calculations describe the same order. Neither is a machine rating, and neither transfers automatically to a different feature pattern or batch sequence.
Identify feature and cutoff constraints
Holes, notches and other operations add work that may control output. Shorter parts can require more cutoff and transfer cycles for a given linear quantity. Ask for demonstrations with the actual feature pattern and length distribution.
Measure waiting at each operation where possible. A faster forming section may simply fill a buffer ahead of a slower secondary station. Beginning and ending work in progress should be recorded so unfinished output is not mistaken for increased delivery.
Measure complete tooling changes
Use the interval from the last accepted old part to the first accepted new part. Include forming tools, entry references, feature tools, cutoff components and inspection. The mechanical exchange of a roll assembly is only one part of the production transition.
Record startup material and operator work as well as elapsed time. A change that appears quicker but creates more rejection or requires extra uncounted labor may not improve the complete cost and output picture.
Account for material supply and handling
Coil changes, strip preparation and material identification interrupt the process at a frequency determined by the order and coil strategy. Discharge, inspection and stacking can create separate constraints, especially for long, delicate or cosmetic profiles.
Observe the normal container and packaging arrangement during a trial. Removing parts manually in an unusually favorable demonstration may conceal the work needed in routine production. Capacity should be assessed through the agreed saleable-part boundary.
Classify losses so improvements have a target
Separate setup, feature work, cutoff delays, handling waits, quality holds and unplanned equipment stops. A single downtime total does not reveal which intervention would help. Associate recurring events with the affected part and material combination.
- Many short batches: examine setup recovery and scheduling.
- Dense features: examine the actual feature-making cycle.
- Full discharge supports: review removal and packing.
- Repeated first-piece corrections: investigate controlled setup recovery.
- Rejected surfaces: trace where the damage first appears.
Compare improvements on equivalent work
Repeat the same or a clearly comparable order basket after a change. Keep drawing, material, acceptance and time boundaries consistent. If the order becomes easier, explain that difference instead of assigning the entire gain to the equipment change.
Include a less favorable workload scenario in delivery planning. More changes, shorter lengths or additional features can reduce the accepted shift total. A range tied to explicit scenarios is more useful than an unsupported single maximum.
Keep capacity evidence with the proposal
A useful report contains the part basket, supplied scope, operating interval, accepted quantity, rejects and stop categories. Attach the material and setup references that explain the trial. Identify any excluded secondary operation or temporary handling arrangement.
This evidence connects the supplier's demonstration to the buyer's production plan. It also creates a baseline for later improvement without requiring every discussion to begin again with an isolated headline speed.
Frequently asked output questions
Why can two custom profiles have very different output?
Their geometry, features, lengths, material and handling routes may differ. Compare complete accepted-part production, not only the forming section's available speed.
Should startup scrap count against capacity?
Record it separately and include the time spent producing it within the agreed interval. It consumes material and production opportunity even though it is not accepted output.
Can scheduling improve output without a new machine?
It may reduce transitions or waiting, but evaluate effects on inventory, order completion and delivery sequence. A larger metre total is not automatically a better customer outcome.
What makes a capacity claim comparable?
The same part basket, material, process boundary, acceptance method and time definition. Keep differences explicit and retain the detailed counts behind the reported rate.
Continue your research
- Custom & Industrial Profile Roll Forming Machines
- Custom Profile Roll Forming Machine
- Hat Channel Roll Forming Machine
- C Channel Production Line
- Z Channel Production Line
- Electrical Cabinet Frame Roll Forming Machine
- How Custom profile roll forming machine Works
- How To Choose a Custom profile roll forming machine
- Custom profile roll forming machine Price: What Affects the Cost?